
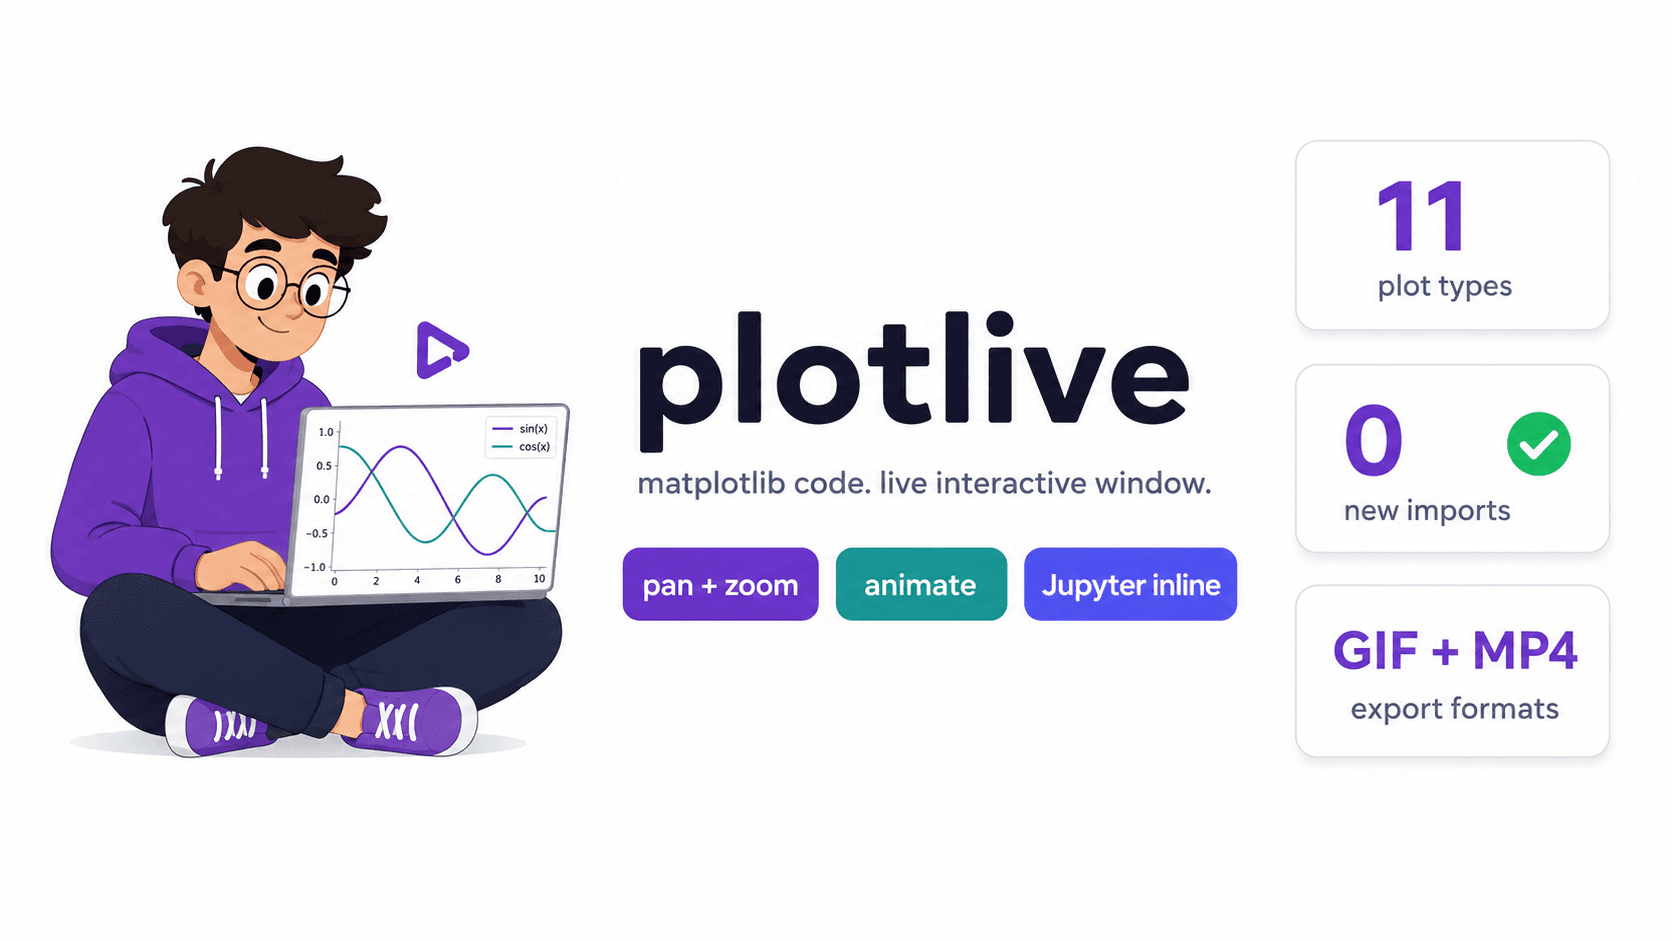
plotlive open-source Python library
Live interactive charts, published on PyPI.
The need
Explore data live (zoom, hover, frame-by-frame playback) without changing matplotlib code.
What we built
A library that swaps plt.show() for an interactive window, with 11 chart types and GIF or MP4 export.
- Python
- pygame-ce
- NumPy
The results
- 11
- chart types
- 124
- unit tests
What the app does, screen by screen
plotlive
- Drop-in replacement for matplotlib's plt.show(). Same import, live pygame window.
- 11 plot types, pan, zoom, hover tooltips, frame-by-frame animation stepping.
- GIF and MP4 export with no display required.
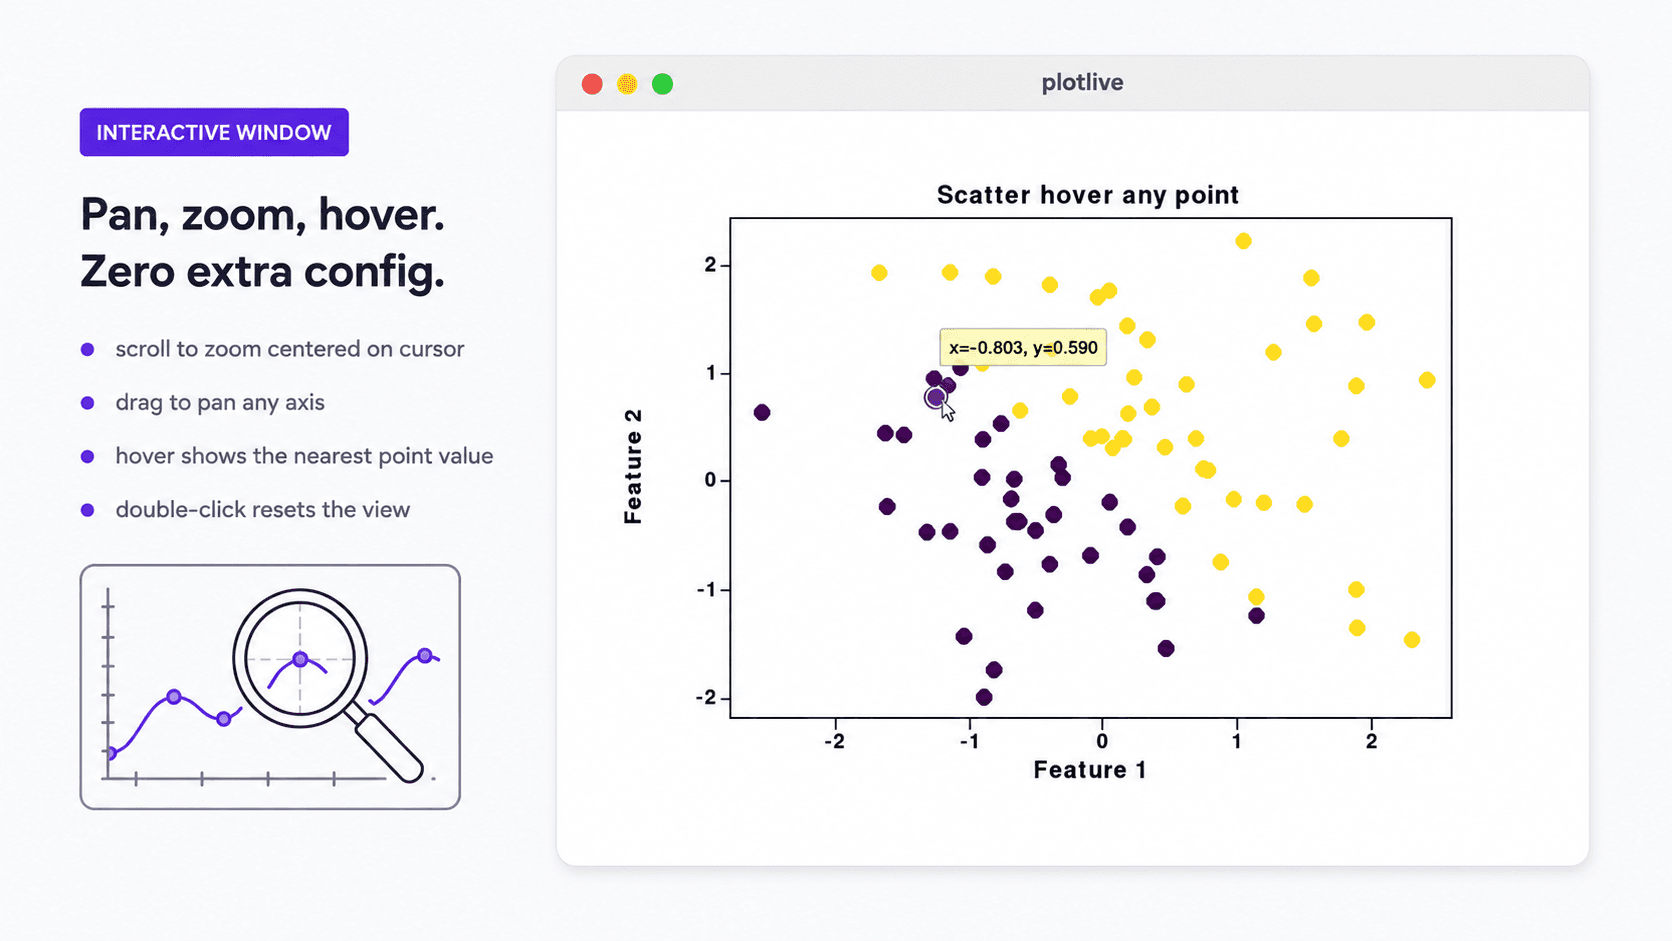
Pan, zoom, hover. Zero extra config.
- Scroll to zoom centered on cursor.
- Drag to pan any axis.
- Hover shows the nearest point value.
- Double-click resets the view.
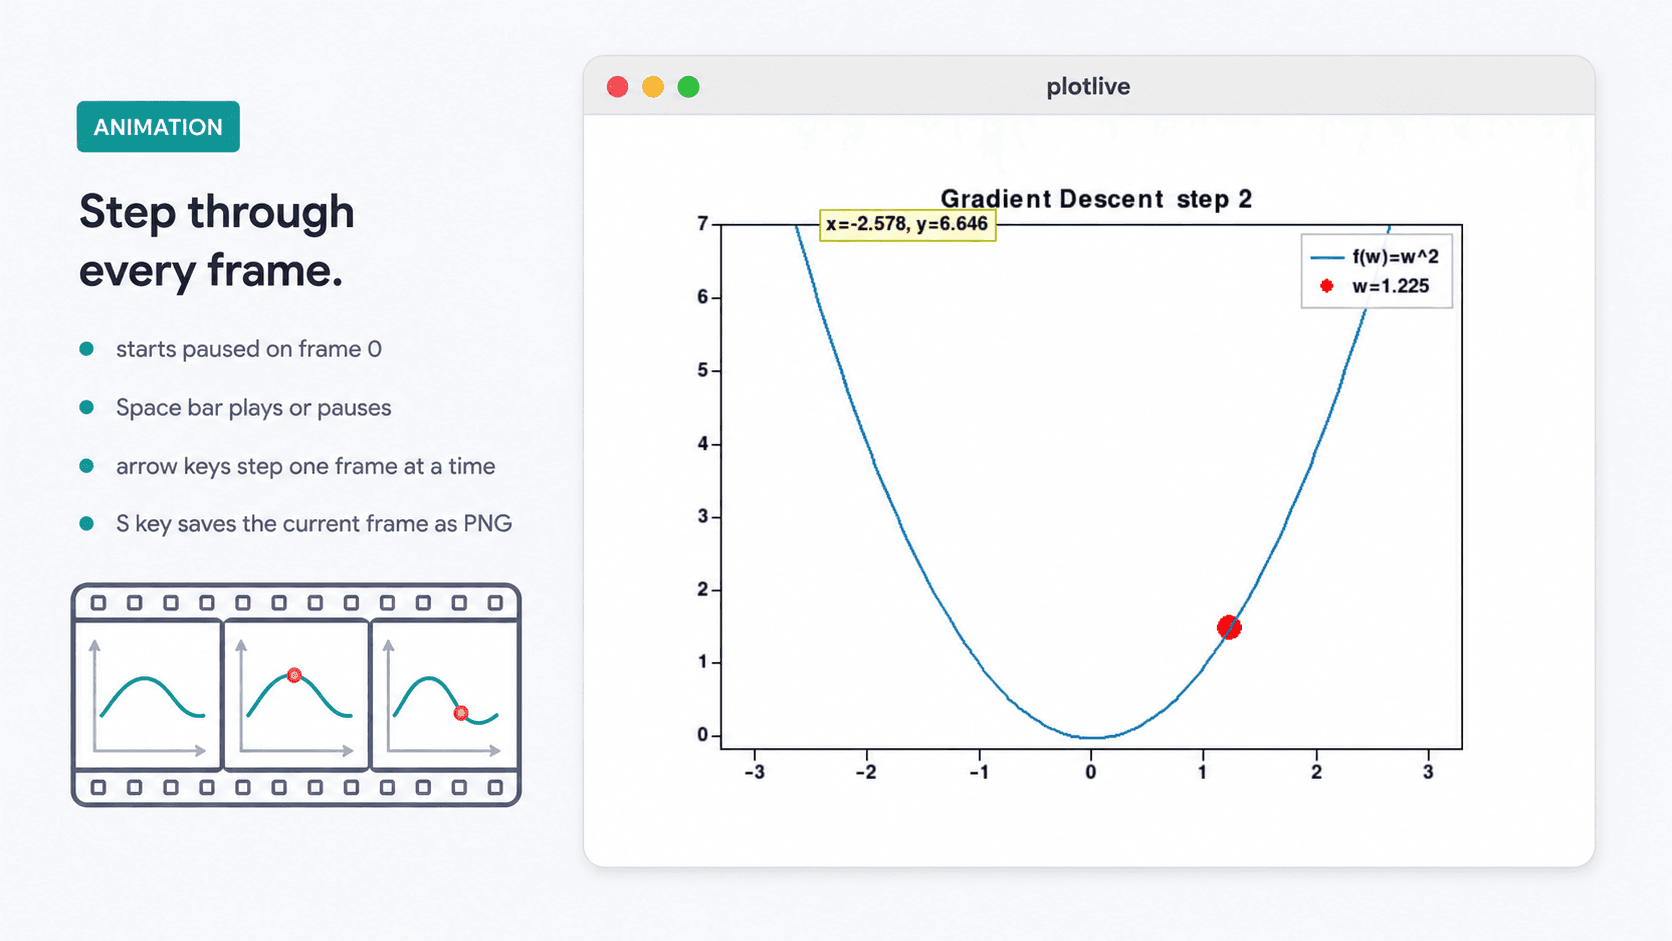
Step through every frame.
- Animations start paused on frame 0.
- Space bar plays or pauses.
- Arrow keys step one frame at a time.
- S key saves the current frame as PNG.
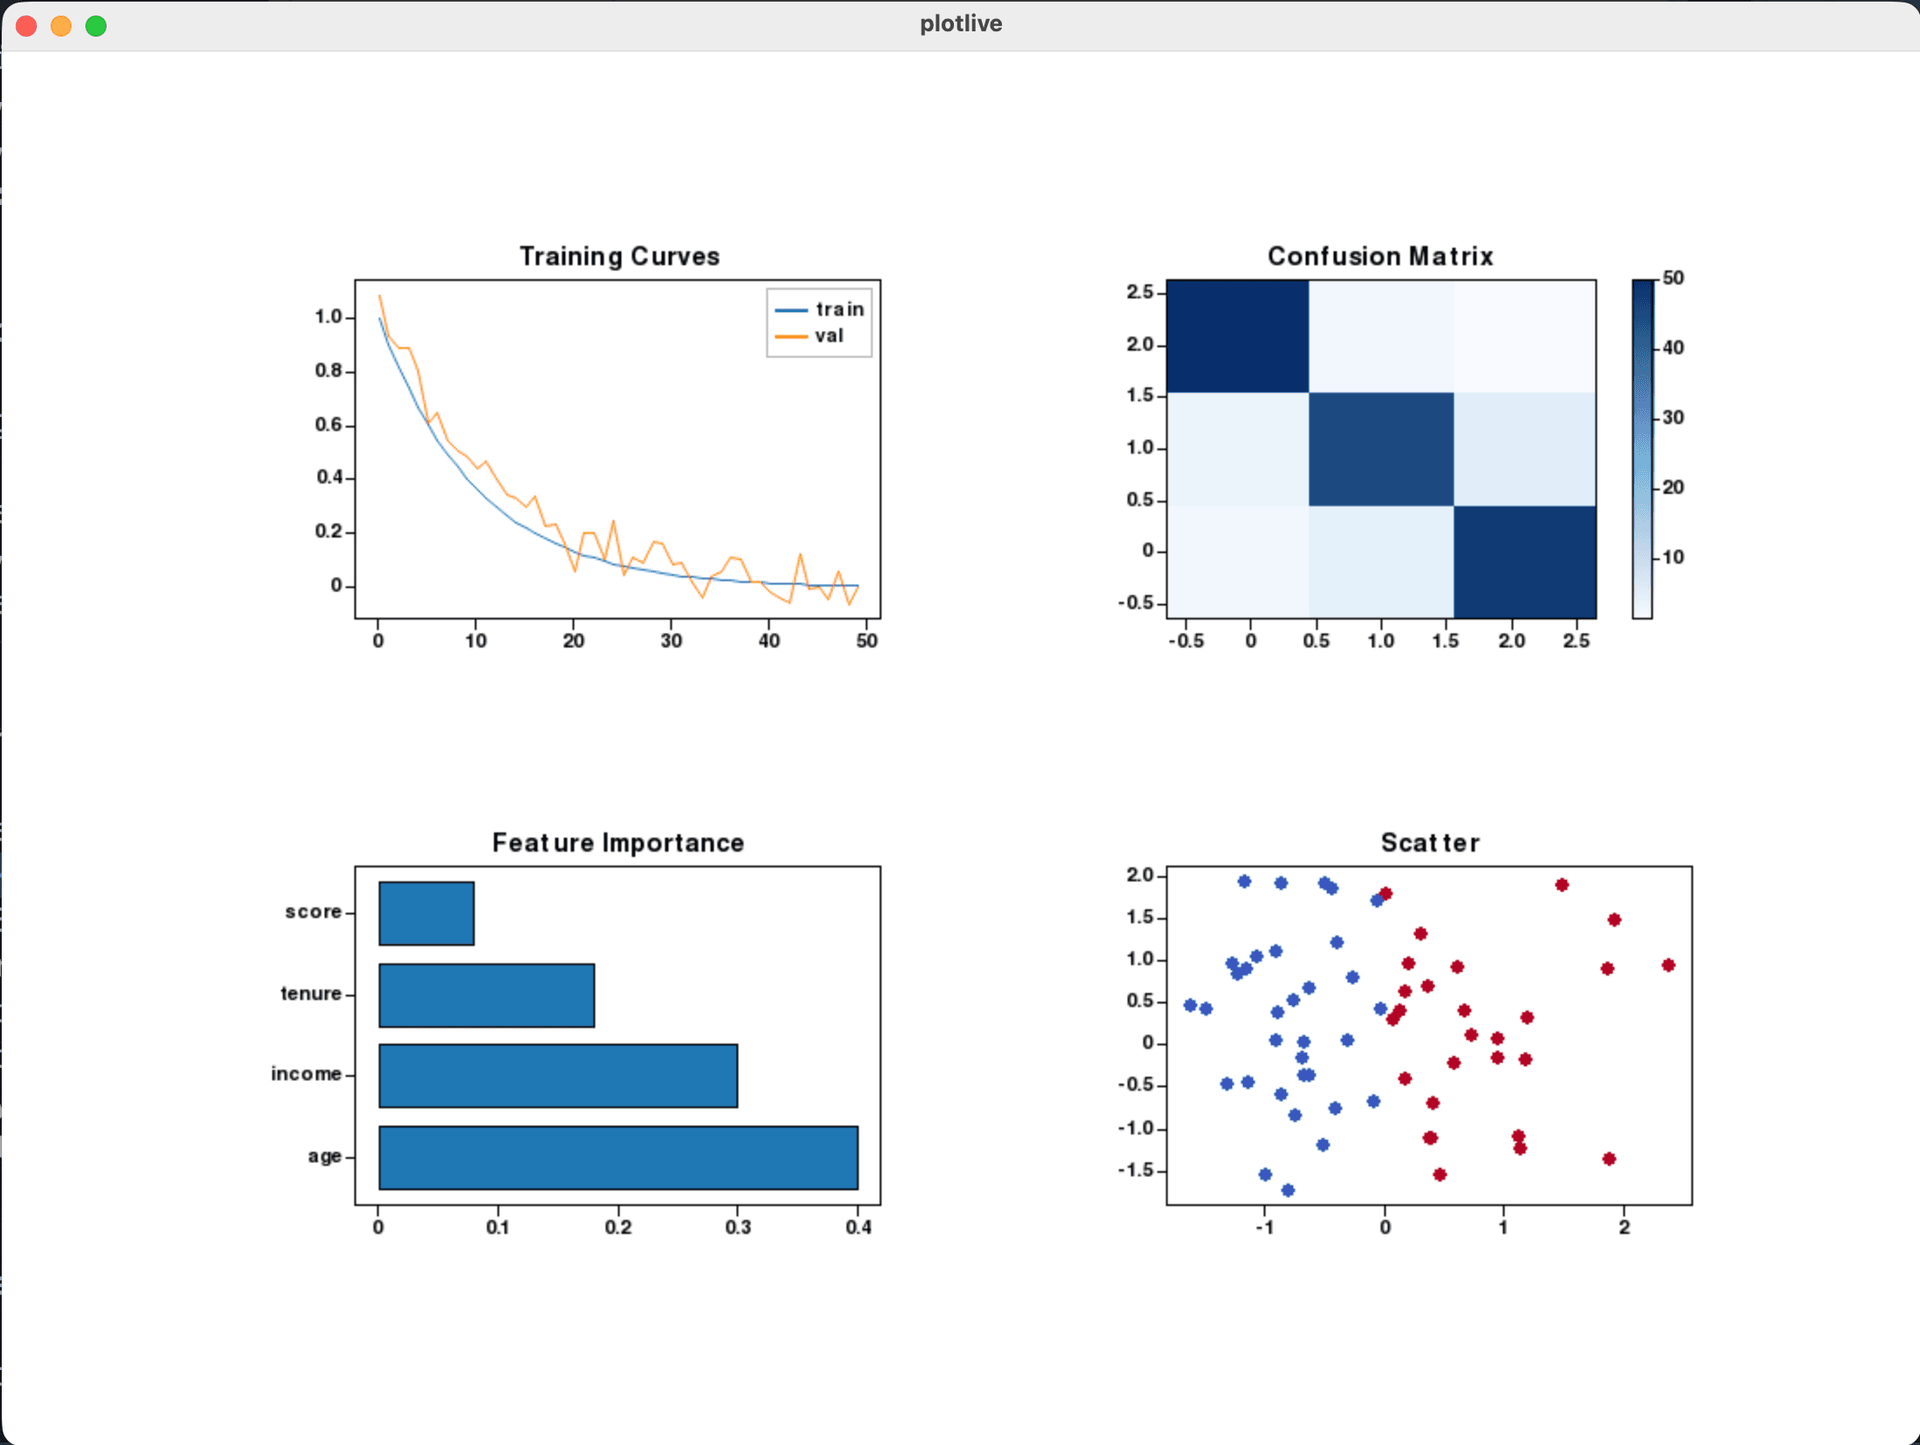
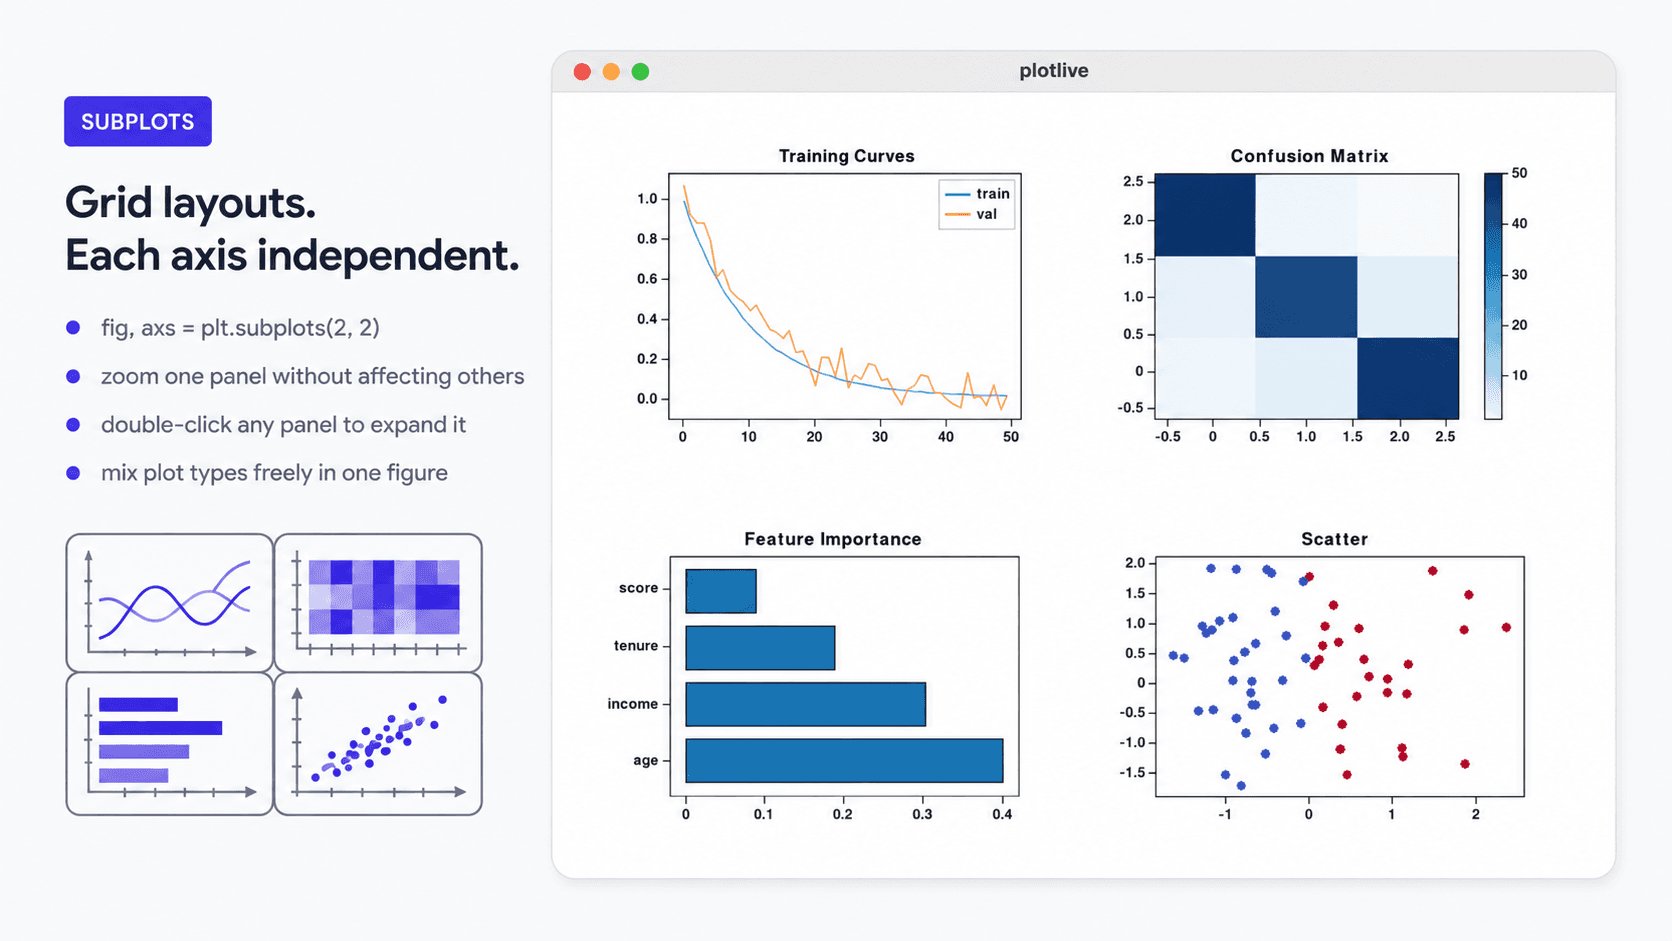
Grid layouts. Each axis independent.
- fig, axs = plt.subplots(2, 2) works as-is.
- Zoom one panel without affecting others.
- Double-click any panel to expand it.
- Mix plot types freely in one figure.
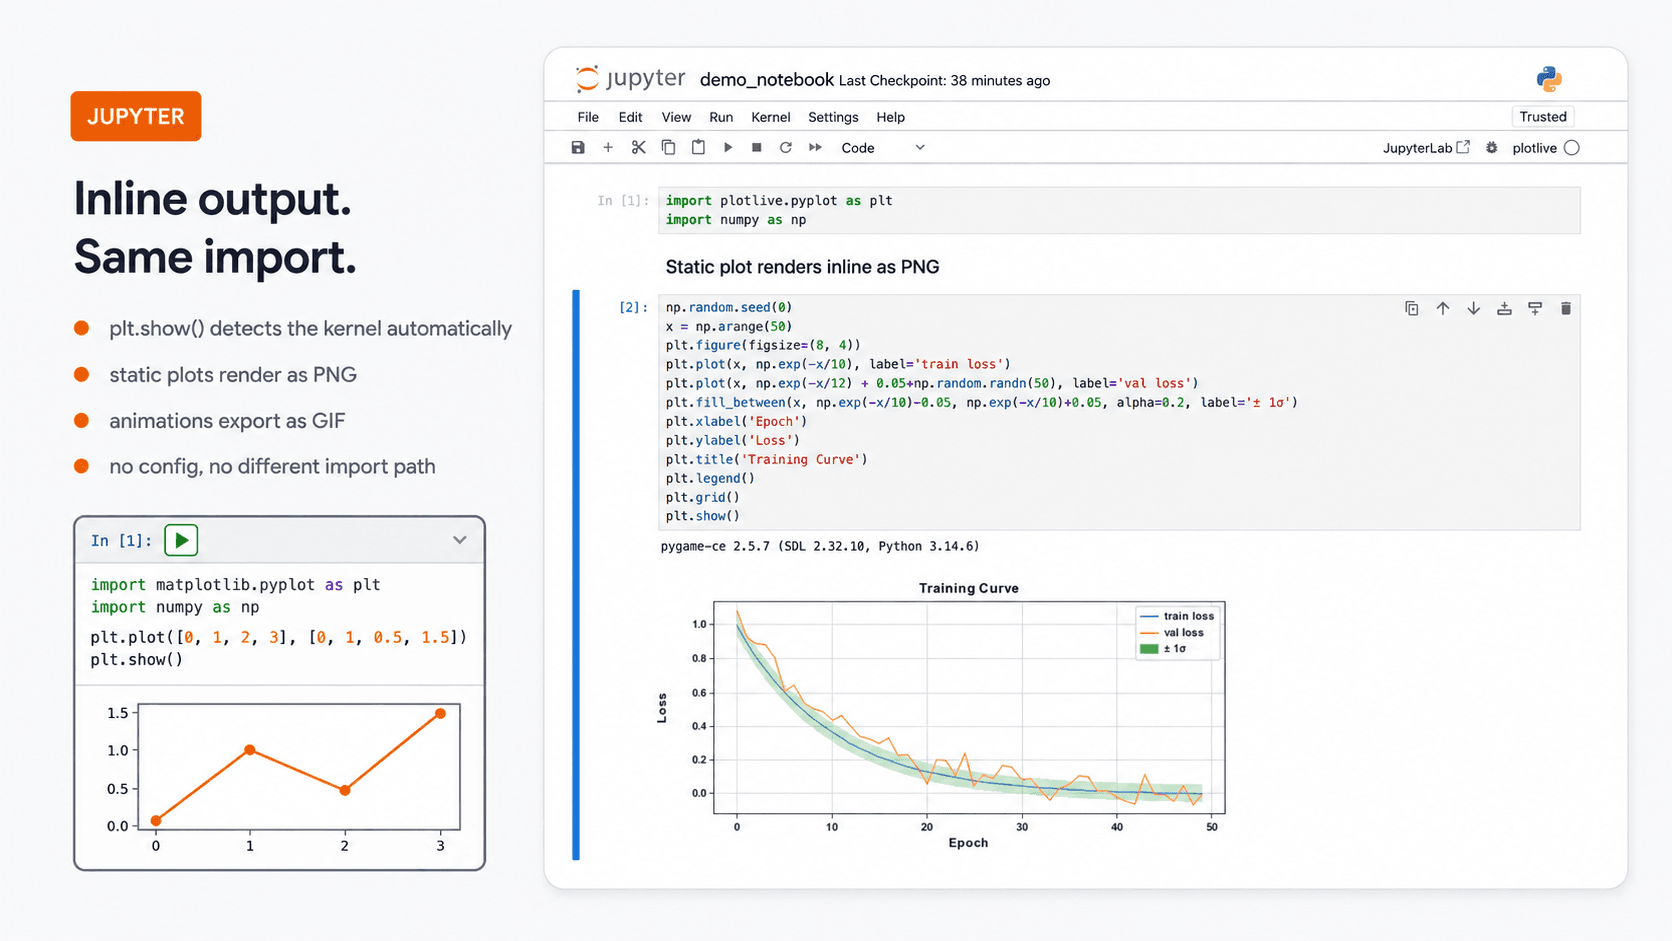
Inline output. Same import.
- plt.show() detects the Jupyter kernel automatically.
- Static plots render as PNG inline.
- Animations export as GIF inline.
- No config, no different import path.
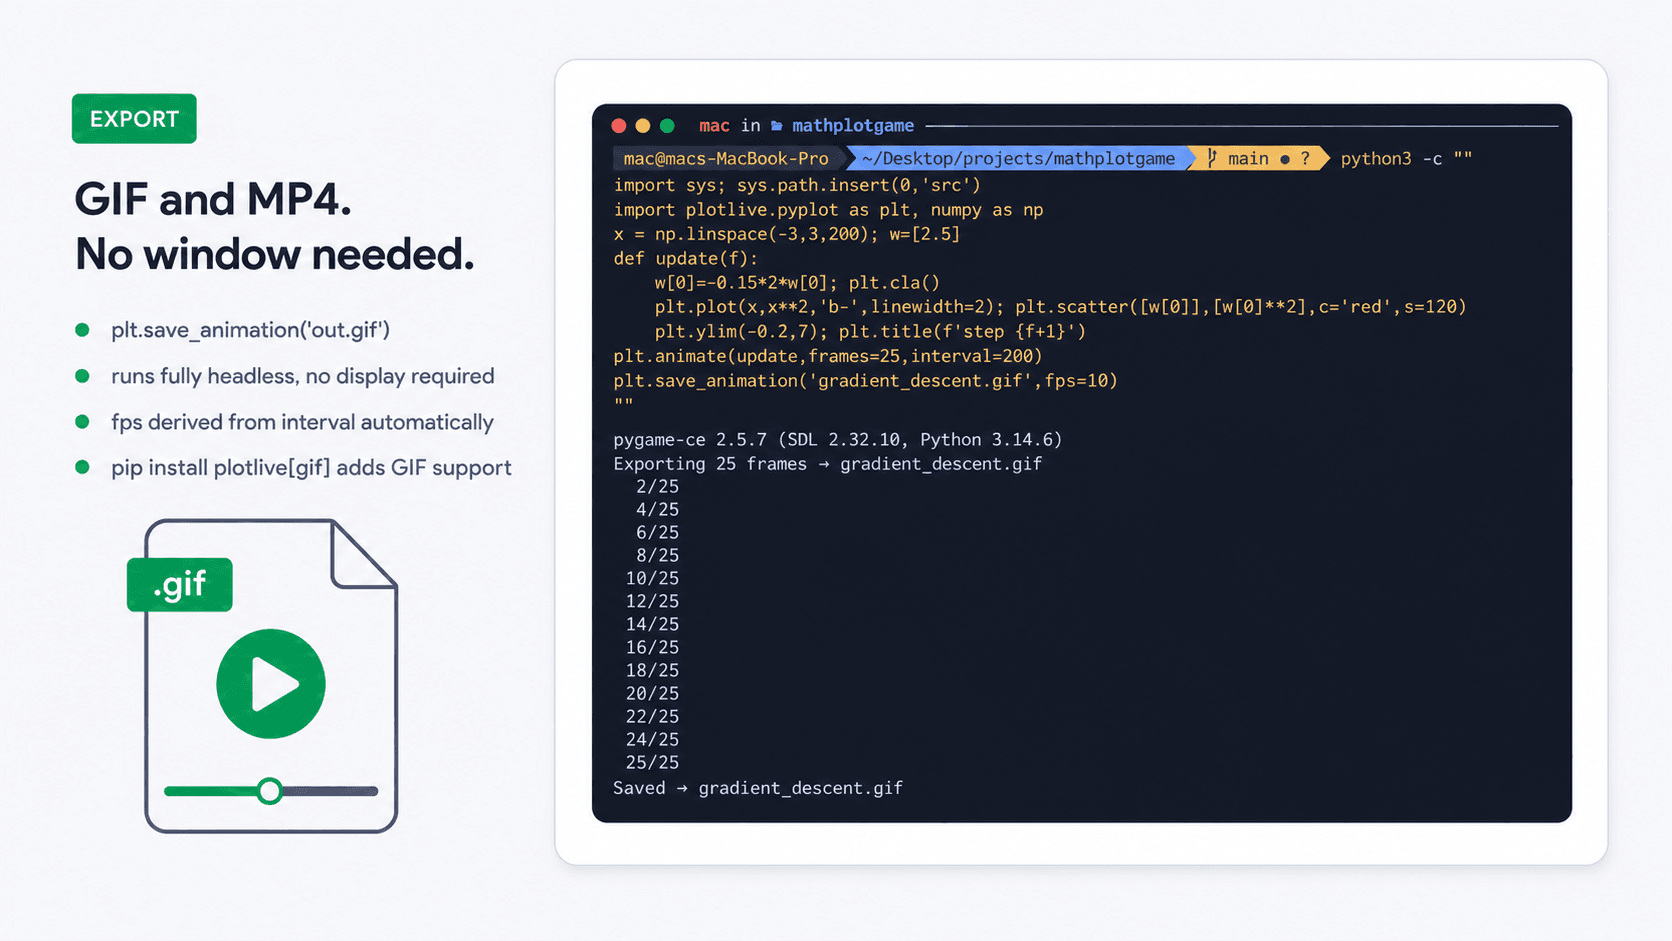
GIF and MP4. No window needed.
- plt.save_animation('out.gif') runs fully headless.
- fps derived from interval automatically.
- Progress printed per frame so long exports are visible.
- pip install plotlive[gif] adds Pillow for GIF support.
A project like this one?
Describe it in two lines on WhatsApp, and we reply directly.
Next project8086 Online IDE